Using valgrind for C programming
When trying to find memory leaks and hotspots in C code, no tool is better than valgrind. I frequently use it when debugging and fixing up pacman code, and I thought I’d share some of my common usage patterns.
Valgrind is more than just memory checking
Most people familiar with valgrind know that it is a very good memory checking tool. However, this is just the default tool that runs when you start valgrind without specifying a --tool option.
man valgrind reveals that it comes with a nice selection of tools. These include cachegrind, callgrind, helgrind, massif, and memcheck. All serve their own purpose, I will talk about a small selection below.
Initial setup
In order to have valgrind provide you with useful information and no useless information, I have it set up the following way for pacman. First, the valgrind.supp file included in the GIT repository helps eliminate spurious warnings during library loading and relocation. In order to use this all the time, set up a .valgrindrc file in your code directory with the following (this instructs valgrind to always run with these options for this project):
 --suppressions=valgrind.supp
 --memcheck:leak-check=full
The second option in this file will be described more below. A quick side note: a local .valgrindrc file will take precedence over any options in ~/.valgrindrc.
memcheck
memcheck is one of the most used tools, and for good reason. C memory management can be tough when you malloc in one place, are using list structures with pointers, and don’t always free everything at the same time. Running valgrind on pacman and going through all of the options is something I’ve tried to do to catch various memleaks. Now you can just run something like this to find problems in pacman:
valgrind --tool=memcheck ./src/pacman/.libs/lt-pacman <operation>
By using lt-pacman instead of just pacman, you can skip a lot of process creation (and thus valgrind output) that the libtool pacman script spits out. Just be sure you have run ./src/pacman/pacman at least once, or lt-pacman won’t exist.
pactest actually has valgrind support slightly integrated, so you can do something like this to find memleaks during pactests (such as one I found on smoke001.py):
./pactest/pactest.py --test ./pactest/tests/<pactest> -p ./src/pacman/.libs/lt-pacman --valgrind
So once you see that their are memory leaks, how do you fix them? That comes with practice. In most cases, the backtraces that the leak-check option prints (above in the .valgrindrc) point to the malloc of the memory, so it is up to you to find where the memory should actually be freed. Sometimes you are lucky- it should be freed in the same functions. Most of the time it is not this easy, and you will have to do some poking around the code to find the right location to free the memory.
callgrind
I don’t think people have fully seen what valgrind can do until they use callgrind on their program. A quick word of warning- using the callgrind tool makes your program run much slower, so try to get your test case right the first time.
In order to use interpret results from callgrind, install kcachegrind. It is an amazing tool and really helps find hotspots in your code. Using callgrind and kcachegrind, I have been able to find several hotspots in libalpm code. Here is one before and after example. As you can see, strcmp was a limiting factor in this particular operation. A few code changes later, I was able to eliminate much of the overhead of it. I just recently made a large fix to the usage of alpm_splitdep which resulted in it being called 1700 times instead of ~1.3 million times in a single run of pacman -Qt.
Here is an example command for tracking down the second fix I made above:
valgrind --tool=callgrind ./src/pacman/.libs/lt-pacman -Qt
After the callgrind run completes, run kcachegrind and open the callgrind.out file. From here, you may see some functions that are hotspots. Navigating the functions is relatively intuitive once you figure out how the program is laid out.
massif
I haven’t used this tool much, but it appears that it could be helpful in seeing how much heap usage your program is using. This will come in useful when trying to get pacman running in low memory environments.
Right now, pacman is rather inefficient with the heap because we allocate static-length strings when creating packages with _alpm_pkg_new as you can see here. When we switch this to dynamically allocated strings, this graph will hopefully show a lot less heap usage.
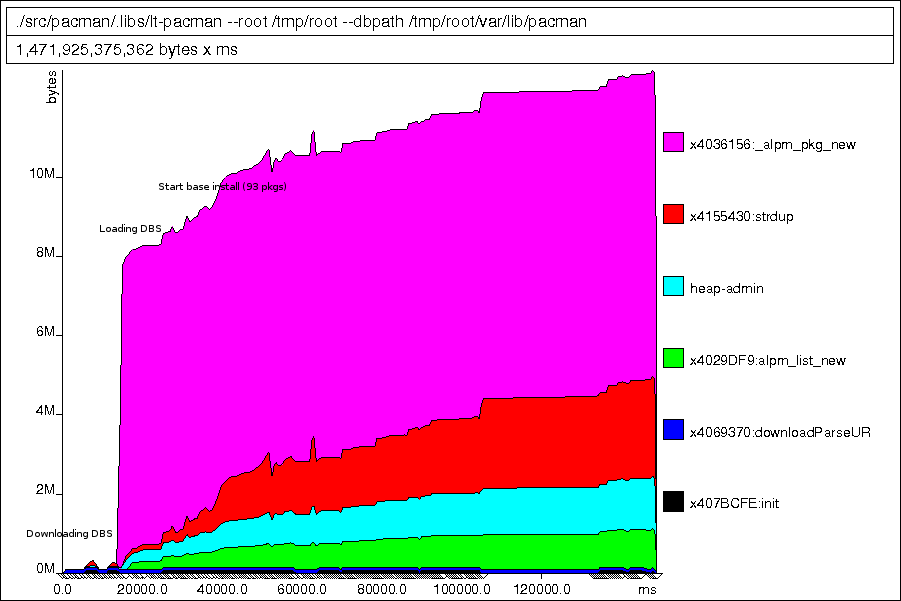
I haven’t used massif in a while, but I believe something like this should work:
valgrind --tool=massif --depth=4 ./src/pacman/.libs/lt-pacman <operation>
This should produce a few files in your working directory once it completes, including a ps (postscript) file. This can be converted to png using some standard tools.
Note that this tool can show a memleak that memcheck doesn’t really catch- high usage of the heap where we always have pointers to our objects, but we hold onto these handles for too long. In the pacman case, you can see that our heap usage never shrinks when running the program, which indicates we don’t free much until the end of the program.
Summary
valgrind is a helpful tool, and is one of many that I use in C development. In the future I’ll try to talk about a few more programs that I use to help write, debug, and clean up code. If you have any questions on anything I talk about, feel free to send me an email and I’ll be glad to help you out.
For much more information on valgrind, be sure to read the manpage as well as the informative valgrind documentation.
See Also
- Valgrind 3.3.0 and the new massif - January 23, 2008
- Using gcov for code coverage testing - December 2, 2007
- i18n console output in C - February 15, 2012
- Unstated coding style - December 21, 2011
- C, unsigned integers, and the infinite for loop - July 19, 2011