Music metadata visualization in Python
I was looking at my music collection this morning and a seemingly simple question came to mind- what bitrate is most of my MP3 music?
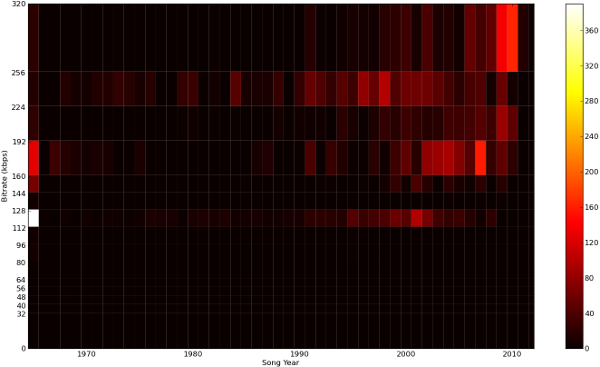
Of course, this simple question descended into a Python script that did much more than the original question, producing the following result, which plots the bitrates vs. ID3-embedded song year in a nice little visualization:
4913 songs played into this picture. Several interesting things to note.
- The left-most line is not my huge collection of music from 1965- instead, this is all the music that was not tagged with a year, which is why that column stands out from the rest.
- The sizes of the boxes do not matter, only the colors do.
- No surprise- the hottest (e.g. most files) point on the plot is unknown year at 128 kbps. Old music files never seem to die! It is good to also see several 192 kbps and 160 kbps files there as well, however.
- Looking across the 128 kbps row, you can see the rise and fall of the Napster era and the effect on my music collection. I think my usage of it peeked in 2001.
- As Napster faded, my collection began to move toward 192 kbps bitrate instead.
- 320 kbps seems to be the new fad, following 192 kbps and 128 kbps being the preferred format. Of course, VBR files are going to be scattered among the different buckets, so it is hard to tell where that plays into the picture.
- A lot of my classic rock collection is ripped from CDs and in FLAC format, so is not on the chart. However, the older songs (1970-1985) seem to show up in the 256 kbps row.
Here is the script: mp3stats.py
Required Python modules for this script are mutagen (MP3 processing), numpy (histogram generation), and matplotlib (visualization). Let me know what you think and if you make any improvements!
See Also
- StreamTheWorld radio streams from the command line - May 16, 2010
- Unstated coding style - December 21, 2011
- Arch Package Visualization - June 23, 2011
- Fast unicode decoding in Python 2.7 - February 27, 2011
- Django South graphmigrations - February 16, 2011
