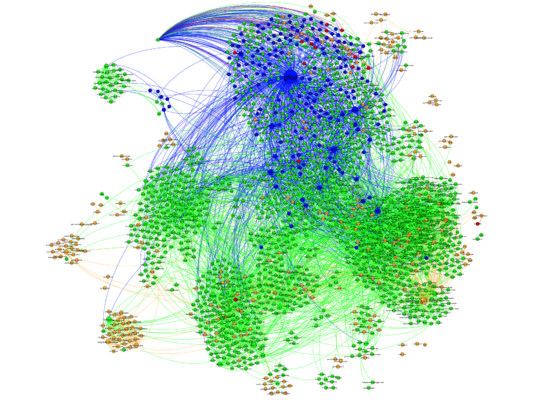
Arch Package Visualization
Nothing like seeing a reddit post, saying you’ll spend a few minutes looking into something, and then realizing you spent multiple hours on it. Today that time sink was Gephi, a pretty cool desktop application for generating graphs from a variety of data sources. It is available in the AUR if you are an Arch Linux user.
I chose a data set I am pretty familiar with, and also one I had an easy time generating the necessary input data for Gephi. Scrapping together a quick Django admin command and basing the data off the Arch Linux website database seemed like the easiest way to get nodes (packages) and some attributes. The edges are of course the dependencies between packages.
The graph here has a few shortcomings, but to me the high-level visualization was more important than getting everything perfectly correct:
- Packages are grouped by pkgbase to prevent explosion of things like firefox-i18n.
- Providers aren’t handled, so you’ll see things like tomcat6 and several python packages floating out on their own where there should probably be links of some sort.
- Only
[core]and[extra]are graphed, and only the ‘x86_64’ architecture is shown (including ‘any’ packages). - Nodes with degree of 0 are omitted; they mainly just clutter the graph.
Even with these known deficiencies, the graph is still pretty awesome.

A full packages PDF is available, which is of very large page size so you can zoom in and see individual packages.
- Nodes are colored according to their repo/arch pair.
[core]packages are blue or red (‘x86_64’ or ‘any’, respectively).[extra]packages are green or orange-ish respectively. - Nodes are sized by the number of incoming edges; not surprisingly the biggest node is
glibc. - Edges are colored according to the requirement side. For example, an edge indicating a
glibcdependency will always be blue. archbootsticks out quite obviously, near the top left. Haskell packages form a nice group up there as well. Other notable groupings: texlive, X.Org/fonts, multimedia packages, xpdf, XFCE4, and the very large Gnome blob.
I may tweak the data generation scripts a bit more to account for provides and things to see if it results in a more informative graph.
Update: Here is the latest Gephi packages file I have. This is using an updated script that handles provides, so things like perl and bash show up much larger than before.
See Also
- Django South graphmigrations - February 16, 2011
- python-pgpdump, a PGP packet parser library - March 8, 2012
- Recent Archweb Improvements - August 27, 2010
- Archweb DB Schema - June 3, 2010
- More Archweb Work - March 10, 2010